
Top 10 Metrics to Measure Content Marketing Performance
Just publishing a bunch of content is not sufficient to improve your visibility. You must also analyze the performance of each piece of content by using different marketing metrics.
If you want your content to be successful, you should be able to use metrics to determine the progress and flaws of the content to improve its performance accordingly.
There are many metrics to analyze the performance of content. Each metric has something different to say about your blog post.
There might be a time when you feel overwhelmed by analyzing content using every metric and drawing a conclusion. So here are the top 10 metrics to help you measure content marketing performance.
- Pageviews
- Unique visitors
- New and returning users
- Average Time
- Bounce rate
- Keywords
- Traffic source
- Organic traffic
- Backlinks
- Dwell Time
By the end of this blog, you’ll know why each of them matters and how to track them.
1. Pageviews
Pageviews show the number of times a particular webpage viewed your site. If the users land on the page and reload it, this metric also includes the supplies as the number of times the webpage is viewed and counts it under pageviews. This means one website visitor can view the page more than once and be responsible for many views.
However, this content marketing metric can help you understand the performance of the content in comparison with other content published simultaneously.
Pageviews metrics can help you identify which content attracts audiences the most. Using this metric, you can strategically move forward on creating and publishing content.
Measure Pageviews Metrics
Google Analytics- Behavior> Site content> All page tab. Sort it by unique pageviews. When data get displayed, you can see which post performs best.
2. Unique visitors
The unique visitors metric counts the number of individuals visiting your page or multiple pages. This metric doesn’t track the number of times individual visits. Instead, it keeps a record of new visitors to the website.
Think of someone visiting your website, browse to other pages, leaving your site, and returning to see more pages. This visitor is counted as a single individual user or unique visitor.
This metric differs from the pageviews metric as it gives accurate insights about the number of times your content has attracted new visitors.
Measure unique visitors metric.
Google Analytics- Audience> Overviews> Top row, second from left. Choose the data period in the upper right corner.
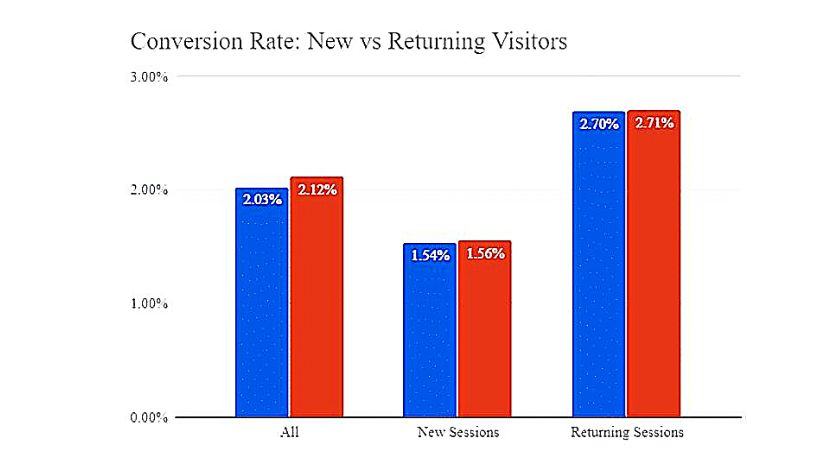
3. New and returning visitors
This shows the ratio between new and returning visitors. New and returning visitors indicate how much your visitors have appreciated your content.
The number of new visitors specifies the number of potential leads, and the number of returning visitors shows if they like your content. It’s better to have a balanced ratio of new and existing visitors.
If you have a balanced ratio, this indicates that your content has successfully brought new visitors and content is engaging enough to retrieve visitors. Ensure a healthy balance, as this shows that your visitors find your content informative and entertaining.
Measure new and returning visitors
Google Analytics- Audience> Behavior > New vs. Returning
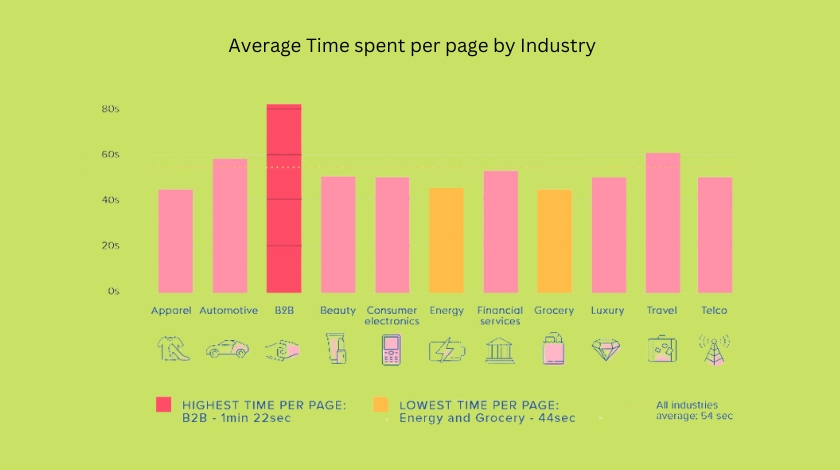
4. Average Time on page
This content marketing metric measures the average time all users have spent on a particular page. The average time on the page indicates whether visitors are reading or skimming the content.
If visitors stay on the page for a shorter duration, this denotes that your visitors do not like your content.
Compare the least-performing article with the best-performing one and find out why some pieces are doing better. Add value to your content by including missing information or driving factors that attract visitors.
Do those contents miss essential images or videos? Are those contents not structured in the proper format? Is the content title not attracting people? Try to find the missing links in the low-performing content.
Measure the average time on the page
Google Analytics- Behavior> Site content> All pages
5. Bounce Rate
The bounce rate is an important metric that indicates the percentage of users who have quit a particular page without visiting any other page on the website.
If the content can meet the expectation of the visitors, there is a high probability that they will move to other content to get more information.
The lower the bounce rate, the better the performance of your content because this indicates that people find your webpage exciting and informative. A higher bounce rate says something is not going right with the page.
The bounce rate in the range of 26%-40% is excellent, 56%-70% on average, and if the bounce rate is above 70%, then some action needs to be taken.
Check the loading speed of the page, CATs. A high bounce rate can also mean people are not finding what they want on a particular webpage.
However, a high bounce rate is average when your visitors return to read new articles to get information and leave the website. It depends on the type of business.
If you have a shopping website, you want a low bounce rate, and a high bounce rate should not bother you much.
Measure bounce rate
Google Analytics- Behavior> Site content> All page
6. Keywords
Using the right keywords or phrases in your content is a formula to bring massive traffic to your website. If you can use the keywords appropriately to answer your audiences’ questions, that can help you rank.
The keyword is also an essential metric in content marketing as it provides data about the performance of your keywords, including information about the phrases your website is getting ranked for.
It also details how often your website appears for those keywords and how much traffic is being driven.
Measure keywords
SEMrush Post Tracking- Projects> Set up a project> Post Tracking tab> Add URL or group of URLs.
You can find out which keywords your webpage is being ranked on SERPs.
7. Traffic Sources
Traffic sources are content marketing metrics showing which sources bring traffic to your website.
This metric can help you discover the best channel to promote the content and help you to shape your content marketing strategy.
Are the visitors discovering your website from a search engine or social media platforms?
Analyzing the traffic source will help you determine the right marketing channel for your content. Identify which channel has larger potential customers, then consider investing your time in it or tweaking your SEO strategy can bring a massive difference. Find what works best for you.
Measure traffic source
Google Analytics- Acquisition> All traffic> channels
8. Organic Traffic
It shows the number of visitors across your website from search engines like Google.
If your content has excellent ranking factors, Google will display it on the first page of SERPs. The audience will visit your website by clicking your link on the research page.
If you have a low figure of organic traffic, then this may denote that the page is not optimized correctly. SEO strategies or tactics can improve the webpage visibility and bring more traffic to your website.
Measure organic traffic
Google Analytics- Acquisition> All traffic> Channels> Check organic search group.
You will get information about the keywords people use to find your website when clicking on it.
9. Backlinks
An authorized link directing to your website is one of the most critical factors in ranking your content; thus, backlinks are vital in content marketing metrics.
Your website appears more often in a search engine if there are a lot of links pointing to your website.
You can get backlinks by writing high-quality and share-worthy content, commenting on high-quality blogs, responding to questions on Quora, writing guest blogs, etc.
Ensure that you’re bringing backlinks from the website with high domain authority, as this increases the chances of ranking.
Measure Backlinks
SEMrush Brand Monitoring Tools- Projects> Set up a project> Mentions> ‘Link to site’ filter. You’ll see all the websites that include links to your website.
10. Dwell time
Dwell time is a content marketing metric that measures the average time visitors spend on the webpage before returning to SERPs. It’s when the visitors just click the link to visit the webpage to evaluate.
This is a crucial metric for SEO. If the visitors come to your webpage and immediately return to SERPs, this gives a negative signal to the search engine and can drop your ranking.
Measure Dwell Time
You can measure it through the bounce rate and time on the page. If your webpage has a low bounce rate and high time on a page, then visitor stays on the page. Therefore you’ll have a high dwell time.
Final Thoughts
Several metrics can guide you in analyzing the performance of the content. Some metrics can be more challenging than others, and it might take time for a change to happen but don’t push or stop tracking.
Analyzing is a simple process that directs and ensures you’re walking on the right path to set up a strong foundation for your blogs. Thus don’t hesitate to invest time and effort in using metrics to analyze content performance.