Understanding Basic Metrics in Google Analytics
Analytics can be a difficult field if you’re just getting started. You need to understand dozens of terms and countless metrics you can track.
However, Google Analytics has made the process as simple as possible. And if you try to learn the ins and outs of analytics, your site will thank you. Google Analytics always helps to understand the basic metrics concepts.
It is a free web analytics tool offered by Google to help you track and analyze website traffic. Google Analytics is also the most widely used web analytics service.
When you proceed armed with this knowledge, nothing will stop you from growing your website in the best way for your brand.
Here are some of the basic metrics you need to understand
#1 Users, New Users, and Returning Users in Google Analytics
Users metric is the number of unique users that opened the pages on your website during a specific timeframe. (week, month, year, etc.).
When a person visits your website for the first time, a Google Analytics cookie will be set, and a unique identifier will be assigned. When the same user revisits your website, the user will be counted as a “returning user.”
You need to pay attention to the New Users metric. If you are delighted by the increasing number of traffic on your website. Remember, this may not imply your audience grows until your new user metric increases.
However, if the same person visits your website from a different device or browser, he will be counted as a New user. And a new unique identifier is assigned to that browser.
Also, if the same person clears their cookies and revisits your website from the same device and browser, he will again be counted as a New user.
Interpretation
The New Users metric helps you identify how effective your marketing efforts, like paid advertisements or social media boosts, were.
Returning user metrics can be very important for websites like publications, tips, and hacks, blogs because it indicates your content is helpful and valuable that users are returning to your websites.

When looking at the site, users always distinguish between new and returning users. Understand how new users and returning users interact. You need to be clear that different type of business has different metrics as their priority depending on their nature and objective.
#2 Source
The traffic source of your website is one of the easiest and most important metrics to find and measure. Some major sources of the traffic are as follows.
- Direct visitors – those who come to your website by directly typing your URL into the address bar in the browser.
- Search visitors – users that have come to your website from the search results of their queries in various search engines like Google, Bing, and Yahoo. Search traffic can be of 2 types :
Organic search- all the traffic from search engines except paid advertisement
Paid search- traffic from the advertisements in search engines
- Referral visitors come from other websites/blogs where your website had a backlink.
- Social – When users click on a link to your website from major social media channels like Facebook, Twitter, Instagram, etc.
- Display: These types of traffic come when the users click on the display ads
Interpretation
These traffic sources can give you many insights into how good your SEO or branding is.
Is your domain name easy to remember? Are your social media campaigns successful in meeting your goal? How well your banner ads are performing? And many more
#3 Pageviews and Unique Pageviews in Google Analytics
In simple language, a pageview is the number of times someone visits any page on your website. If the same person visits the same page on your website in the same session, the pageview still increases.
If the person reloads the page, the pageview increases again. So, page views are the total aggregate of the views a page on your website gets.
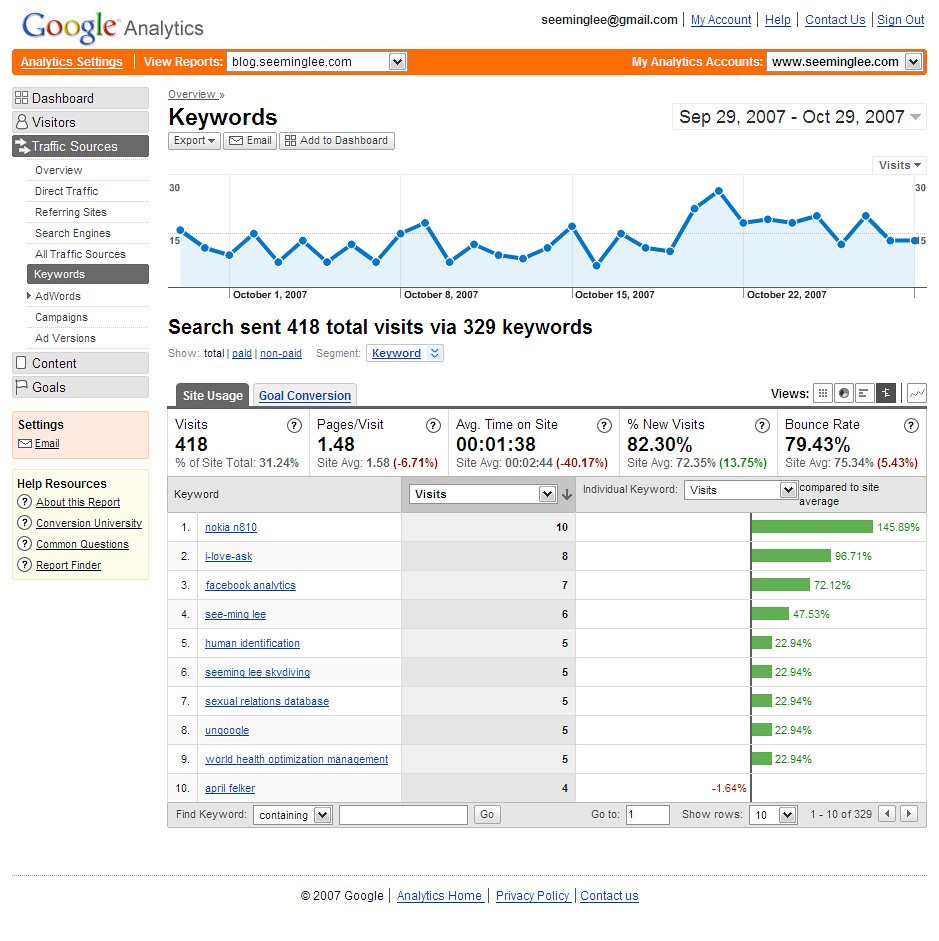
According to Google, “A unique pageview aggregates pageviews generated by the same user during the same session.” So if the same user visits the same page 10 times and reloads it multiple times in the same session, the unique pageview is still counted as one.
Interpretation
Pageviews allow you to track how the traffics interact with your sites. You can know which page on your website is generating more traffic. You can understand what type of content people are interested in.
A higher pageview usually implies quality and valuable content. At the same time, when your pageview is relatively higher than your unique page views, this may imply that users are not finding what they are looking for and keep poking around pages. They may be reloading your page that is not showing correctly.
#4 Bounce Rate
When people visit your website and they leave your website after viewing only one page, it is called a bounce session.
The bounce Rate is the percentage of bounce sessions on your website. Suppose your website had 100 sessions, and 20 were single-page sessions. Now the bounce rate of your website is 20/100, which is 20%.

But not all session that ends after only one page is bounce session! If the user interacts (event occurs) on your webpage and leaves, it’s not a bounce session. Interaction events are parameters that can be set up in Google Analytics, such as clicks, downloads, video plays, form submissions, etc.
Interpretation
In a simple context, bounce rate helps you evaluate the content of your webpage. You want users to visit your website and explore your pages and content.
You will have a high bounce rate if your content is not engaging enough. A high bounce rate helps you identify User Experience (UX) problems.
Bounce rate is also considered a ranking factor for search engines like Google. A high bounce rate can decrease your website ranking, but it also depends on the type of website.
Websites like Wikipedia and Quora are expected to have a high bounce rate because people come and leave after getting the information. So, the metric is less relevant in the ranking factor. So, a high bounce rate isn’t necessarily bad.
A high bounce rate doesn’t necessarily mean users are not engaged on your web page because the bounce rate doesn’t consider the amount of time spent by the user on the web page.
Example: A user enters your website’s blog section, reads the whole content for 30 minutes, and closes the website. This is also counted as a bounce, but the user was fully engaged, so other metrics like average session duration should be combined to understand the behavior of the users.
#5 Average Session Duration
First, let’s talk about Session; Session is the number of times a user opens a browser to a page on your website.
A single user can have multiple sessions. According to Google, A session is a group of user interactions with your website that takes place within a given time frame.
For example, a single session can contain multiple page views, events, social interactions, and e-commerce transactions.
According to Google, the average session duration is calculated by dividing the total duration of all sessions (in seconds) by the number of sessions.
So basically, the average session duration is how long a user interacts with your site.
However, the time spent on the last page of the session is not calculated unless you have set up Google Analytics events and the user performs that event.
Average session duration doesn’t indicate how long a user spent on your website because it doesn’t take the time spent on the last page by the user even though the user may have spent long, time-consuming content on the last page of his/her session.
Interpretation
Average session duration helps you to assess how engaging your contents are. A low average session duration could indicate your content is not delivering the information users want. It could also be due to various reasons like poor site design and poor internal linking.
Average session duration also determines your Search Engine Optimization (SEO). But it also depends upon the nature of your website.
If your website is only for a blog, people are expected to read a page and exit, so a low average session may not be bad. Search Engines also consider this and give less weight when ranking.
Average session duration is directly related to several significant metrics, such as bounce rate and pages visited per session. Understanding what avg. session duration and how it’s calculated will help provide additional context on these metrics.
#6 Exit Page & Exit Percentage on Google Analytics
Exit Page on Google Analytics refers to the last page a user accesses before their session ends, or they leave the site. The Exit Pages section of Google Analytics lets you see which pages people most frequently end their sessions on or leave the site after viewing.
Your website’s bounce rates are not totally derived from the home page. Your brand’s final call to action (or conversion) will often be on the second or third page of a process.
To maximize your conversions, you will need to investigate further into the exits and find out at which stage of the process the visitors are leaving the website.
Interpretation
When you figure this out, then you may be able to modify the process accordingly. The steps to complete your website’s call to action should be only two or three pages from the content (or products) the website visitor sought.
When the process becomes complicated, the goods or services will simply become “not worth the hassle” to potential customers.
This is just one of these things that should be tested in the research and data collection phase of building a website, but sometimes it may be overlooked or have room for major improvement.




One Comment